The GRASS GIS Development team has announced the release of the new major version GRASS GIS 7.0.0. This version provides many new functionalities including spatio-temporal database support, image segmentation, estimation of evapotranspiration and emissivity from satellite imagery, automatic line vertex densification during reprojection, more LIDAR support and a strongly improved graphical user interface experience. GRASS GIS 7.0.0 also offers significantly improved performance for many raster and vector modules: “Many processes that would take hours now take less than a minute, even on my small laptop!” explains Markus Neteler, the coordinator of the development team composed of academics and GIS professionals from around the world. The software is available for Linux, MS-Windows, Mac OSX and other operating systems.

Detailed announcement and software download:
https://grass.osgeo.org/news/42/15/GRASS-GIS-7-0-0/

About GRASS GIS
The Geographic Resources Analysis Support System https://grass.osgeo.org/, commonly referred to as GRASS GIS, is an open source Geographic Information System providing powerful raster, vector and geospatial processing capabilities in a single integrated software suite. GRASS GIS includes tools for spatial modeling, visualization of raster and vector data, management and analysis of geospatial data, and the processing of satellite and aerial imagery. It also provides the capability to produce sophisticated presentation graphics and hardcopy maps. GRASS GIS has been translated into about twenty languages and supports a huge array of data formats. It can be used either as a stand-alone application or as backend for other software packages such as QGIS and R geostatistics. It is distributed freely under the terms of the GNU General Public License (GPL). GRASS GIS is a founding member of the Open Source Geospatial Foundation (OSGeo).

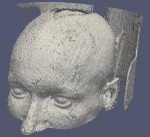
brainscan1Last year (2013) I “enjoyed” a brain CT scan in order to identify a post-surgery issue – luckily nothing found. Being in Italy, like all patients I received a CD-ROM with the scan data on it: so, something to play with! In this article I’ll show how to easily turn 2D scan data into a volumetric (voxel) visualization.

The CT scan data come in a DICOM format which ImageMagick is able to read and convert. Knowing that, we furthermore need the open source software packages GRASS GIS 7 and Paraview to get the job done.

First of all, we create a new XY (unprojected) GRASS location to import the data into:

# create a new, empty location (or use the Location wizard):
grass70 -c ~/grassdata/brain_ct

We now start GRASS GIS 7 with that location. After mounting the CD-ROM we navigate into the image directory therein. The directory name depends on the type of CT scanner which was used in the hospital. The file name suffix may be .IMA.

Now we count the number of images, convert and import them into GRASS GIS:

# list and count
LIST=`ls -1 *.IMA`
MAX=`echo $LIST | wc -w`

# import into XY location:
curr=1
for i in $LIST ; do

# pretty print the numbers to 000X for easier looping:
curr=`echo $curr | awk ‘{printf “%04d\n”, $1}’`
convert “$i” brain.$curr.png
r.in.gdal in=brain.$curr.png out=brain.$curr
r.null brain.$curr setnull=0
rm -f brain.$curr.png
curr=`expr $curr + 1`

done

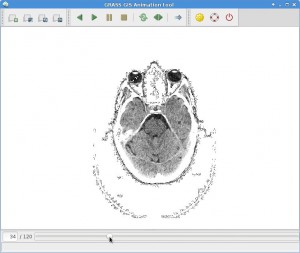
At this point all CT slices are imported in an ordered way. For extra fun, we can animate the 2D slices in g.gui.animation:

Animation of brain scan slices
(click to enlarge)

# enter in one line:
g.gui.animation rast=`g.mlist -e rast separator=comma pattern=”brain*”`

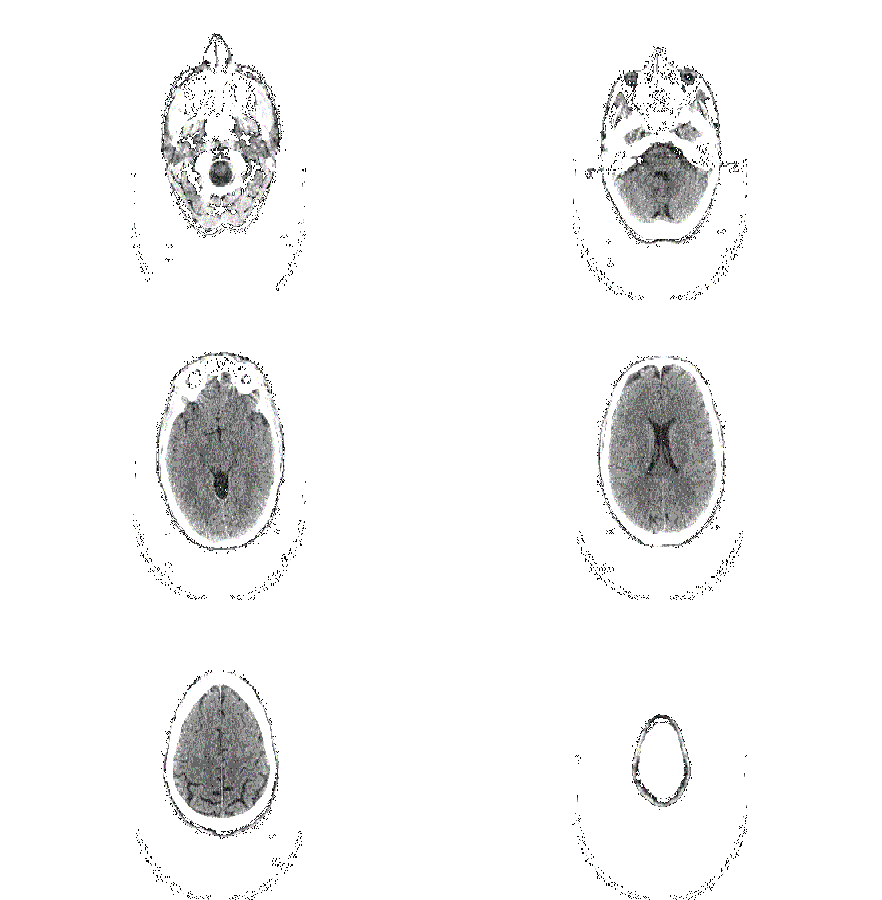
The tool allows to export as animated GIF or AVI:

Animation of brain scan slices (click to enlarge)

Now it is time to generate a volume:

# first count number of available layers
g.mlist rast pat=”brain*” | wc -l

# now set 3D region to number of available layers (as number of depths)
g.region rast=brain.0003 b=1 t=$MAX -p3

At this point the computational region is properly defined to our 3D raster space. Time to convert the 2D slices into voxels by stacking them on top of each other:

# convert 2D slices to 3D slices:
r.to.rast3 `g.mlist rast pat=”brain*” sep=,` out=brain_vol

We can now look at the volume with GRASS GIS’ wxNVIZ or preferably the extremely powerful Paraview. The latter requires an export of the volume to VTK format:

# fetch some environment variables
eval `g.gisenv -s`
# export GRASS voxels to VTK 3D as 3D points, with scaled z values:
SCALE=2
g.message “Exporting to VTK format, scale factor: $SCALE”
r3.out.vtk brain_vol dp=2 elevscale=$SCALE \
output=${PREFIX}_${MAPSET}_brain_vol_scaled${SCALE}.vtk -p

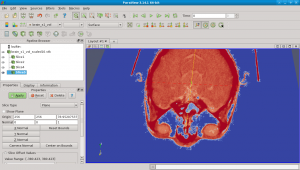
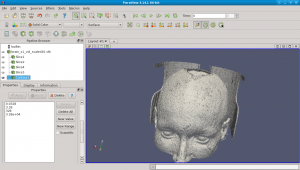
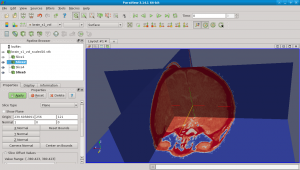
Eventually we can open this new VTK file in Paraview for visual exploration:

# show as volume
# In Paraview: Properties: Apply; Display Repres: volume; etc.
paraview –data=brain_s1_vol_scaled2.vtk

markus_brain_ct_scan3 markus_brain_ct_scan4 markus_brain_ct_scan2


Fairly easy!

BTW: I have a scan of my non-smoker lungs as well :-)