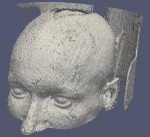
 Last year (2013) I “enjoyed” a brain CT scan in order to identify a post-surgery issue – luckily nothing found. Being in Italy, like all patients I received a CD-ROM with the scan data on it: so, something to play with! In this article I’ll show how to easily turn 2D scan data into a volumetric (voxel) visualization.
The CT scan data come in a DICOM format which ImageMagick is able to read and convert. Knowing that, we furthermore need the open source software packages GRASS GIS 7 and Paraview to get the job done.
First of all, we create a new XY (unprojected) GRASS location to import the data into:
# create a new, empty location (or use the Location wizard):
grass70 -c ~/grassdata/brain_ct
We now start GRASS GIS 7 with that location. After mounting the CD-ROM we navigate into the image directory therein. The directory name depends on the type of CT scanner which was used in the hospital. The file name suffix may be .IMA.
Now we count the number of images, convert and import them into GRASS GIS:
# list and count
LIST=`ls -1 *.IMA`
MAX=`echo $LIST | wc -w`
# import into XY location:
curr=1
for i in $LIST ; do
# pretty print the numbers to 000X for easier looping:
curr=`echo $curr | awk ‘{printf “%04d\n”, $1}’`
convert “$i” brain.$curr.png
r.in.gdal in=brain.$curr.png out=brain.$curr
r.null brain.$curr setnull=0
rm -f brain.$curr.png
curr=`expr $curr + 1`
done
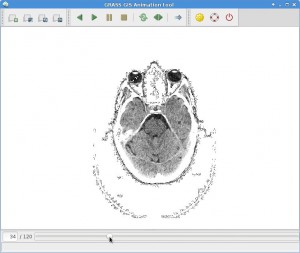
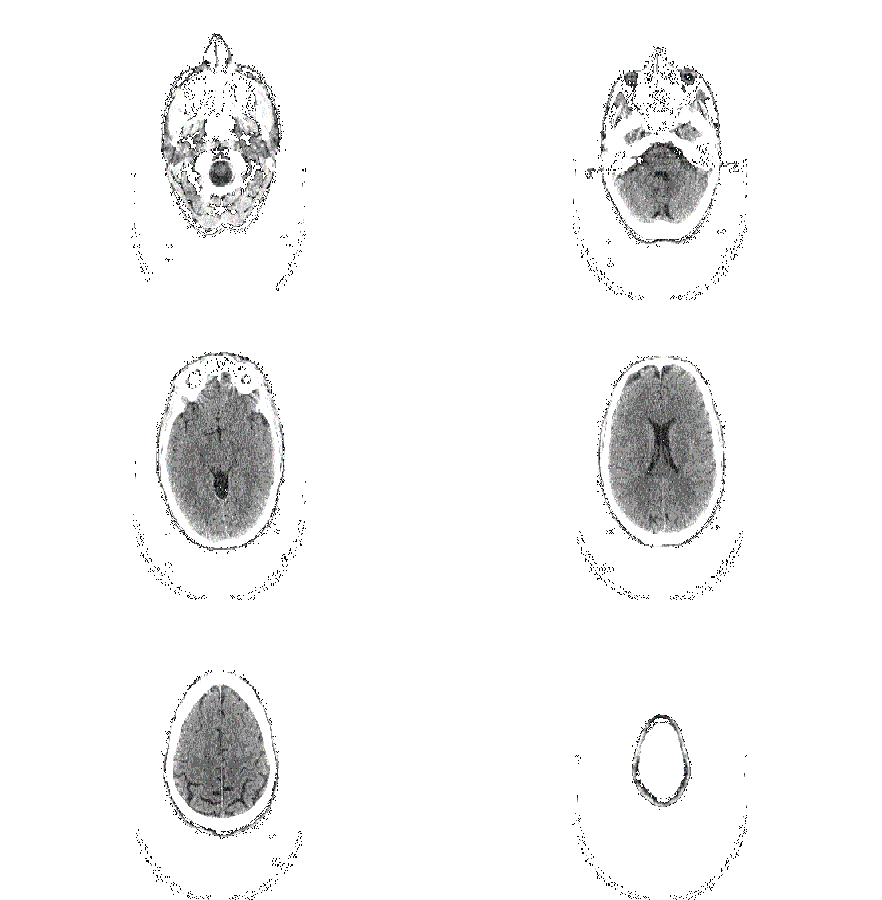
At this point all CT slices are imported in an ordered way. For extra fun, we can animate the 2D slices in g.gui.animation:
# enter in one line:
g.gui.animation rast=`g.mlist -e rast separator=comma pattern=”brain*”`
The tool allows to export as animated GIF or AVI:
Now it is time to generate a volume:
# first count number of available layers
g.mlist rast pat=”brain*” | wc -l
# now set 3D region to number of available layers (as number of depths)
g.region rast=brain.0003 b=1 t=$MAX -p3
At this point the computational region is properly defined to our 3D raster space. Time to convert the 2D slices into voxels by stacking them on top of each other:
# convert 2D slices to 3D slices:
r.to.rast3 `g.mlist rast pat=”brain*” sep=,` out=brain_vol
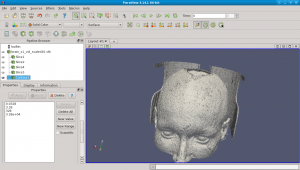
We can now look at the volume with GRASS GIS’ wxNVIZ or preferably the extremely powerful Paraview. The latter requires an export of the volume to VTK format:
# fetch some environment variables
eval `g.gisenv -s`
# export GRASS voxels to VTK 3D as 3D points, with scaled z values:
SCALE=2
g.message “Exporting to VTK format, scale factor: $SCALE”
r3.out.vtk brain_vol dp=2 elevscale=$SCALE \
output=${PREFIX}_${MAPSET}_brain_vol_scaled${SCALE}.vtk -p
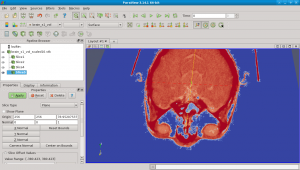
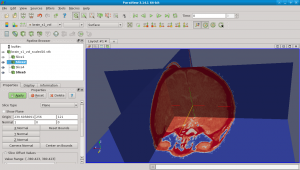
Eventually we can open this new VTK file in Paraview for visual exploration:
# show as volume
# In Paraview: Properties: Apply; Display Repres: volume; etc.
paraview –data=brain_s1_vol_scaled2.vtk
Fairly easy!
BTW: I have a scan of my non-smoker lungs as well :-)

 Follow
 Follow