Selective data removal in an elevation map by means of floodfilling
Do you also sometimes get maps which contain zero (0) rather than NULL (no data) in some parts of the map? This can be easily solved with “floodfilling”, even in a GIS.
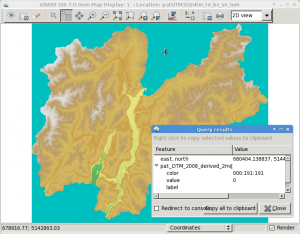
My original map looks like this (here, Trentino elevation model):
Now what? In a paint software we would simply use bucket fill but what about GIS data? Well, we can do something similar using “clumping”. It requires a bit of computational time but works perfectly, even for large DEMs, e.g., all Italy at 20m resolution. Using the open source software GRASS GIS 7, we can compute all “clumps” (that are many for a floating point DEM!):
# first we set the computational region to the raster map:
g.region rast=pat_DTM_2008_derived_2m -p
r.clump pat_DTM_2008_derived_2m out=pat_DTM_2008_derived_2m_clump
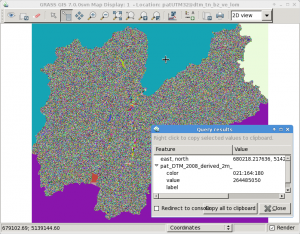
The resulting clump map produced by r.clump is nicely colorized:
As we can see, the area of interest (province) is now surrounded by three clumps. With a simple map algebra statement (r.mapcalc or GUI calculator) we can create a MASK by assigning these outer boundary clumps to NULL and the other “good” clumps to 1:
r.mapcalc "no_data_mask = if(pat_DTM_2008_derived_2m_clump == 264485050 || \
  pat_DTM_2008_derived_2m_clump == 197926480 || \
  pat_DTM_2008_derived_2m_clump == 3, null(), 1)"
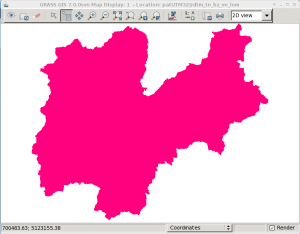
This mask map looks like this:
We now activate this MASK and generate a copy of the original map into a new map name by using map algebra again (this just keeps the data matched by the MASK). Eventually we remove the MASK and verify the result:
# apply the mask
r.mask no_data_mask
# generate a copy of the DEM, filter on the fly
r.mapcalc "pat_DTM_2008_derived_2m_fixed = pat_DTM_2008_derived_2m"
# assign a nice color table
r.colors pat_DTM_2008_derived_2m_fixed color=srtmplus
# remove the MASK
r.mask -r
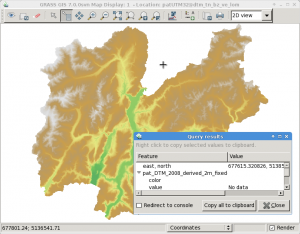
And the final DEM is now properly cleaned up in terms of NULL values (no data):
Enjoy.


 Follow
 Follow
Trackbacks & Pingbacks
[…] Do you also sometimes get maps which contain zero (0) rather than NULL (no data) in some parts of the map? This can be easily solved with “floodfilling”, even in a GIS. My original map looks like this (here, Trentino elevation model): Now what? […]
Leave a Reply
Want to join the discussion?Feel free to contribute!